There are multiple ways of plotting a multi-color line in matplotlib. A special property of the plot command allowing plotting multiple datasets in columns of 2D arrays makes it possible to do this with a single plot command using the cycler for the colors. Here are a sample code segment for this.
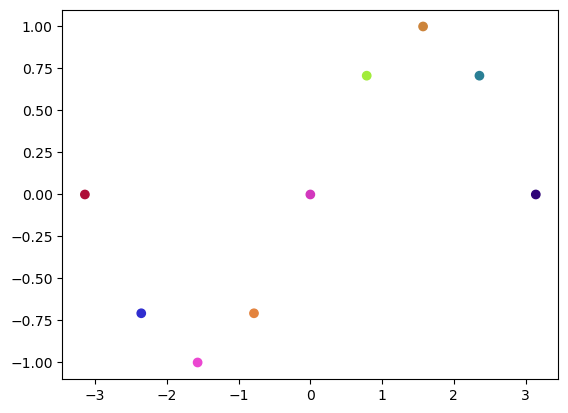
Generate sample data
import numpy as np
import matplotlib.pyplot as plt
from cycler import cycler

x = np.linspace(-np.pi,np.pi,9)
y = np.sin(x)
rng = np.random.default_rng(123)
c = rng.uniform(size=(len(x),3))

plt.scatter(x,y,c=c)
plt.show()
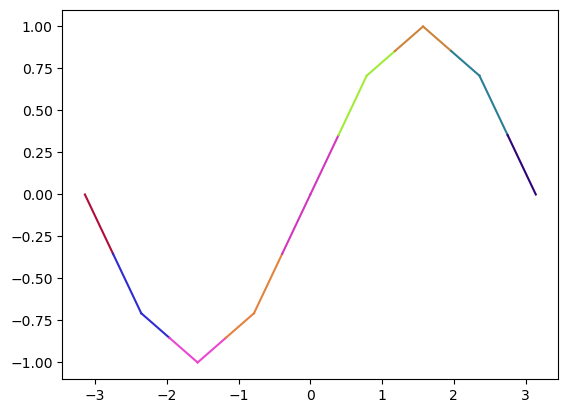
Quick plotting with line colors
plt.gca().set_prop_cycle(cycler('color',c[:-1]))
plt.plot(np.c_[x[:-1],x[1:]].T,np.c_[y[:-1],y[1:]].T)
plt.show()
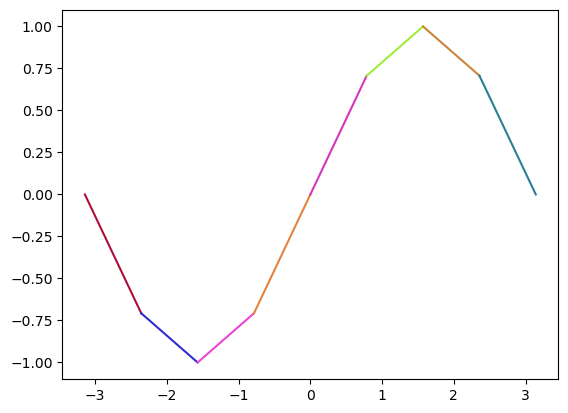
More careful plotting with point colors
y_ = (y[:-1]+y[1:])/2
x_ = (x[:-1]+x[1:])/2

plt.gca().set_prop_cycle(cycler('color',c[:-1]))
plt.plot(np.c_[x[:-1],x_].T,np.c_[y[:-1],y_].T)
plt.gca().set_prop_cycle(cycler('color',c[1:]))
plt.plot(np.c_[x_,x[1:]].T,np.c_[y_,y[1:]].T)
plt.show()